See it live
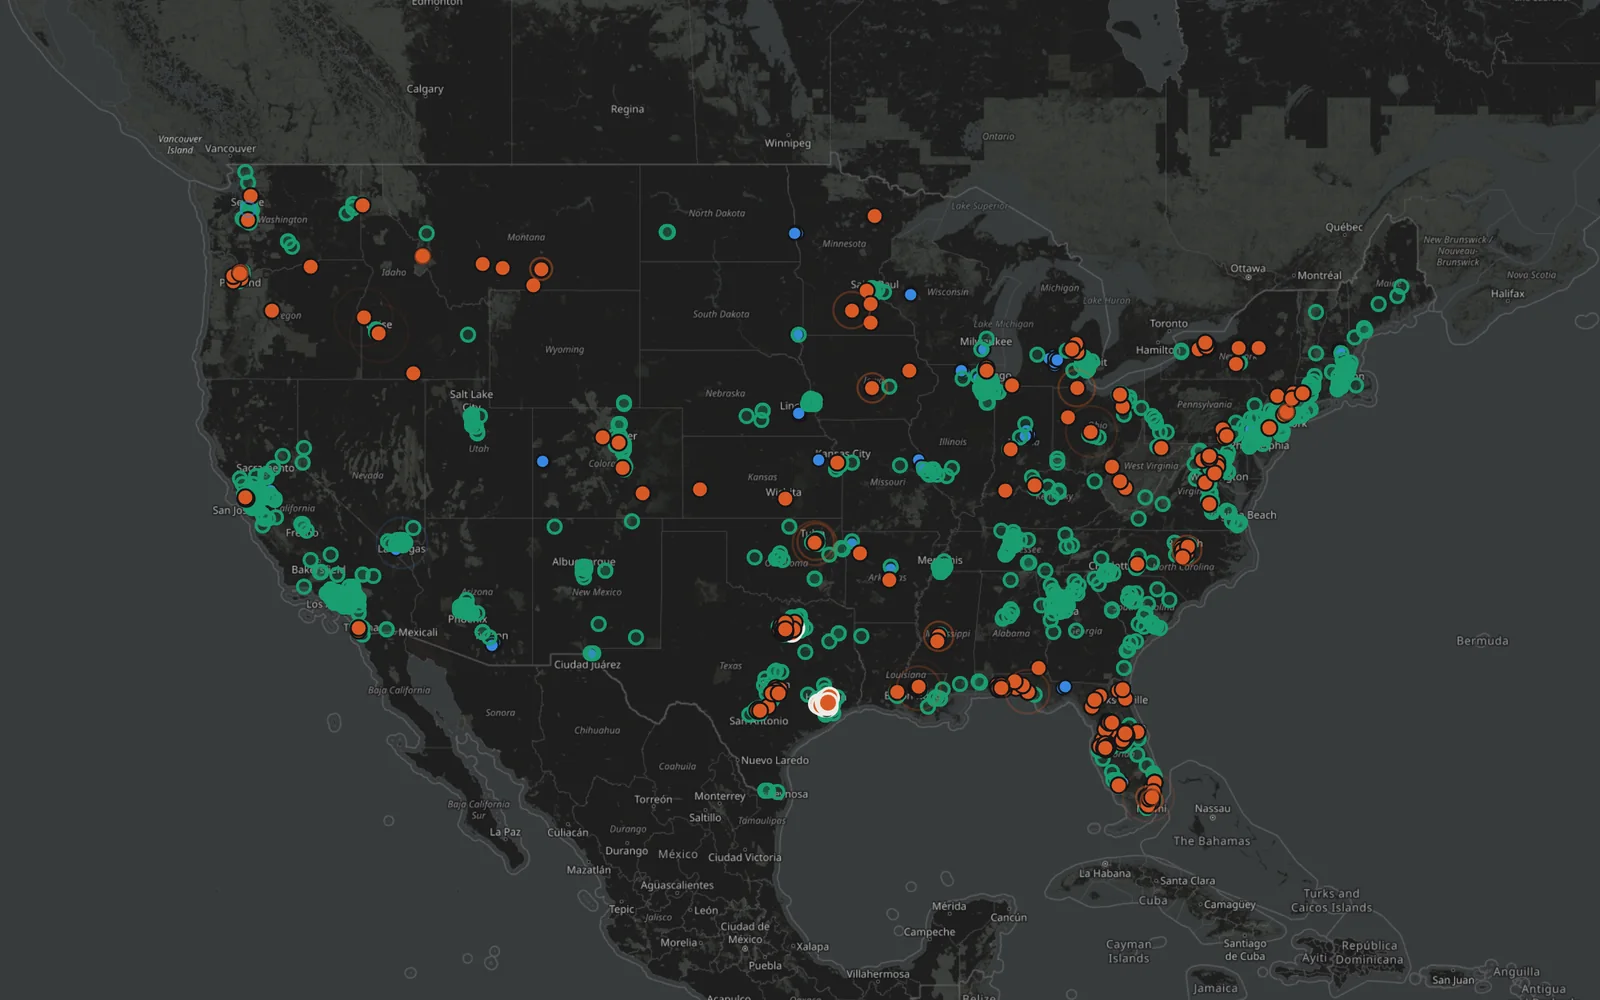
Watch customers without power across the country, with the last 24 hours, the current grid mix, and the status of each source.

09Energy & public data

The power outage record for every US county.
Live readings. A decade of records.
01The project
Power Out Map shows how often the power goes out, for how long, and how fast it comes back, in every US county since 2015. A live map reads utilities’ public outage maps every 15 minutes, and the historical record is built from 15-minute federal outage data. Utilities without a public map are missing, so the live figure is a floor.
Open the live outage map, find your county, or replay the biggest outages hour by hour on the official Power Out Map website.
Explore poweroutmap.com02A closer look
Watch customers without power across the country, with the last 24 hours, the current grid mix, and the status of each source.
Search by county name or ZIP code to see its record, alongside rankings of the most and least reliable counties, states, and utilities.
Step through major outages hour by hour, from Hurricane Irma to the Texas freeze, and read stories on storms, wildfire shutoffs, and costs.
Continue exploring